API
-
class
deltascope.brain¶ Object to manage biological data and associated functions.
-
add_aligned_df(df)¶ Adds dataframe of aligned data
Warning
Calculates model, but assumes that the dimensions of the fit are x and z
Parameters: df (pd.DataFrame) – Dataframe of aligned data Returns: brain.df_align
-
add_thresh_df(df)¶ Adds dataframe of thresholded and transformed data to
brain.df_threshParameters: df (pd.DataFrame) – dataframe of thesholded and transformed data Returns: brain.df_thresh
-
align_data(df_fit, fit_dim, deg=2, mm=None, vertex=None, flip=None)¶ Apply PCA transformation matrix and align data so that the vertex is at the origin
Creates
brain.df_alignandbrain.mmParameters: - df (pd.DataFrame) – dataframe containing thresholded xyz data
- comp_order (array) – Array specifies the assignment of components to x,y,z. Form [x component index, y component index, z component index], e.g. [0,2,1]
- fit_dim (array) – Array of length two containing two strings describing the first and second axis for fitting the model, e.g. [‘x’,’z’]
- deg (int) – (or None) Degree of the function that should be fit to the model. deg=2 by default
- mm – (
math_modelor None) Math model for primary channel - vertex (array) – (or None) Array of type [vx,vy,vz] (
brain.vertex) indicating the translation values - flip (Bool) – (or None) Boolean value to determine if the data should be rotated by 180 degrees
-
df_align¶ Dataframe containing point data aligned using PCA
-
mm¶ Math model object fit to data in brain object
-
calc_coord(row)¶ Calculate alpah, r, theta for a particular row
Parameters: row (pd.Series) – row from dataframe in the form of a pandas Series Returns: pd.Series populated with coordinate of closest point on the math model, r, theta, and ac (arclength)
-
calculate_pca_median(data, threshold, radius, microns)¶ Calculate PCA transformation matrix,
brain.pcamed, based on data (brain.pcamed) after applying median filter and thresholdParameters: - data (array) – 3D array containing raw probability data
- threshold (float) – Value between 0 and 1 indicating the lower cutoff for positive signal
- radius (int) – Radius of neighborhood that should be considered for the median filter
- microns (array) – Array with three values representing the x,y,z micron dimensions of the voxel
-
median¶ Pandas dataframe containing data that has been processed with a median filter twice and thresholded
-
pcamed¶ PCA object managing the transformation matrix and any resulting transformations
-
calculate_pca_median_2d(data, threshold, radius, microns)¶ Calculate PCA transformation matrix for 2 dimensions of data,
brain.pcamed, based on data after applying median filter and thresholdWarning
fit_dim is not used to determine which dimensions to fit. Defaults to x and z
Parameters: - data (array) – 3D array containing raw probability data
- threshold (float) – Value between 0 and 1 indicating the lower cutoff for positive signal
- radius (int) – Radius of neighborhood that should be considered for the median filter
- microns (array) – Array with three values representing the x,y,z micron dimensions of the voxel
-
create_dataframe(data, scale)¶ Creates a pandas dataframe containing the x,y,z and signal/probability value for each point in the
brain.raw_dataarrayParameters: - data (array) – Raw probability data in 3D array
- scale (array) – Array of length three containing the micron values for [x,y,z]
Returns: Pandas DataFrame with xyz and probability value for each point
-
find_arclength(xc)¶ Calculate arclength by integrating the derivative of the math model in xy plane
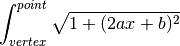
Parameters: row (float) – Postion in the x axis along the curve Returns: Length of the arc along the curve between the row and the vertex Return type: float
-
find_distance(t, point)¶ Find euclidean distance between math model(t) and data point in the xy plane
Parameters: - t (float) – float value defining point on the line
- point (array) – array [x,y] defining data point
Returns: distance between the two points
Return type: float
-
find_min_distance(row)¶ Find the point on the curve that produces the minimum distance between the point and the data point using scipy.optimize.minimize(
brain.find_distance())Parameters: row (pd.Series) – row from dataframe in the form of a pandas Series Returns: point in the curve (xc, yc, zc) and r Return type: floats
-
find_r(row, zc, yc, xc)¶ Calculate r using the Pythagorean theorem
Parameters: - row (pd.Series) – row from dataframe in the form of a pandas Series
- yc (float) – Y position of the closest point in the curve to the data point
- zc (float) – Z position of the closest point in the curve to the data point
- xc (float) – X position of hte closest point in the curve to the data point
Returns: r, distance between the point and the model
Return type: float
-
find_theta(row, zc, yc)¶ Calculate theta for a row containing data point in relationship to the xz plane
Parameters: - row (pd.Series) – row from dataframe in the form of a pandas Series
- yc (float) – Y position of the closest point in the curve to the data point
- zc (float) – Z position of the closest point in the curve to the data point
Returns: theta, angle between point and the model plane
Return type: float
-
fit_model(df, deg, fit_dim)¶ Fit model to dataframe
Parameters: - df (pd.DataFrame) – Dataframe containing at least x,y,z
- deg (int) – Degree of the function that should be fit to the model
- fit_dim (array) – Array of length two containing two strings describing the first and second axis for fitting the model, e.g. [‘x’,’z’]
Returns: math model
Return type:
-
flip_data(df)¶ Rotate data by 180 degrees
Parameters: df (dataframe) – Pandas dataframe containing x,y,z data Returns: Rotated dataframe
-
integrand(x)¶ Function to integrate to calculate arclength
Parameters: x (float) – integer value for x Returns: arclength value for integrating Return type: float
-
pca_transform_2d(df, pca, comp_order, fit_dim, deg=2, mm=None, vertex=None, flip=None)¶ Transforms df in 2D based on the PCA object, pca, whose transformation matrix has already been calculated
Calling
brain.align_data()createsbrain.df_alignWarning
fit_dim is not used to determine which dimensions to fit. Defaults to x and z
Parameters: - df (pd.DataFrame) – Dataframe containing thresholded xyz data
- pca (pca_object) – A pca object containing a transformation object, e.g.
brain.pcamed - comp_order (array) – Array specifies the assignment of components to x,y,z. Form [x component index, y component index, z component index], e.g. [0,2,1]
- fit_dim (array) – Array of length two containing two strings describing the first and second axis for fitting the model, e.g. [‘x’,’z’]
- deg (int) – (or None) Degree of the function that should be fit to the model. deg=2 by default
- mm – (
math_modelor None) Math model for primary channel - vertex (array) – (or None) Array of type [vx,vy,vz] (
brain.vertex) indicating the translation values - flip (Bool) – (or None) Boolean value to determine if the data should be rotated by 180 degrees
-
pca_transform_3d(df, pca, comp_order, fit_dim, deg=2, mm=None, vertex=None, flip=None)¶ Transforms df in 3D based on the PCA object, pca, whose transformation matrix has already been calculated
Parameters: - df (pd.DataFrame) – Dataframe containing thresholded xyz data
- pca (pca_object) – A pca object containing a transformation object, e.g.
brain.pcamed - comp_order (array) – Array specifies the assignment of components to x,y,z. Form [x component index, y component index, z component index], e.g. [0,2,1]
- fit_dim (array) – Array of length two containing two strings describing the first and second axis for fitting the model, e.g. [‘x’,’z’]
- deg (int) – (or None) Degree of the function that should be fit to the model. deg=2 by default
- mm – (
math_modelor None) Math model for primary channel - vertex (array) – (or None) Array of type [vx,vy,vz] (
brain.vertex) indicating the translation values - flip (Bool) – (or None) Boolean value to determine if the data should be rotated by 180 degrees
-
plot_projections(df, subset)¶ Plots the x, y, and z projections of the input dataframe in a matplotlib plot
Parameters: - df (pd.DataFrame) – Dataframe with columns: ‘x’,’y’,’z’
- subset (float) – Value between 0 and 1 indicating what percentage of the df to subsample
Returns: Matplotlib figure with three labeled scatterplots
-
preprocess_data(threshold, scale, microns)¶ Thresholds and scales data prior to PCA
Creates
brain.threshold,brain.df_thresh, andbrain.df_sclParameters: - threshold (float) – Value between 0 and 1 to use as a cutoff for minimum pixel value
- scale (array) – Array with three values representing the constant by which to multiply x,y,z respectively
- microns (array) – Array with three values representing the x,y,z micron dimensions of the voxel
-
threshold¶ Value used to threshold the data prior to calculating the model
-
df_thresh¶ Dataframe containing only points with values above the specified threshold
-
df_scl¶ Dataframe containing data from
brain.df_threshafter a scaling value has been applied
-
process_alignment_data(data, threshold, radius, microns)¶ Applies a median filter twice to the data which is used for alignment
Ensures than any noise in the structural data does not interfere with alignment
Parameters: - data (array) – Raw data imported by the function
brain.read_data() - threshold (float) – Value between 0 and 1 to use as a cutoff for minimum pixel value
- radius (int) – Integer that determines the radius of the circle used for the median filter
- microns (array) – Array with three values representing the x,y,z micron dimensions of the voxel
Returns: Dataframe containing data processed with the median filter and threshold
- data (array) – Raw data imported by the function
-
read_data(filepath)¶ Reads 3D data from file and selects appropriate channel based on the assumption that the channel with the most zeros has zero as the value for no signal
Parameters: filepath (str) – Filepath to hdf5 probability file Returns: Creates the variable brain.raw_data-
raw_data¶ Array of shape [z,y,x] containing raw probability data
-
-
setup_test_data(size=None, gthresh=0.5, scale=[1, 1, 1], microns=[0.16, 0.16, 0.21], mthresh=0.2, radius=20, comp_order=[0, 2, 1], fit_dim=['x', 'z'], deg=2)¶ Setup a test dataset to use for testing transform coordinates :param int size: Number of points to sample for the test dataset
-
subset_data(df, sample_frac=0.5)¶ Takes a random sample of the data based on the value between 0 and 1 defined for sample_frac
Creates the variable
brain.subsetParameters: - pd.DataFrame – Dataframe which will be sampled
- sample_frac (float) – (or None) Value between 0 and 1 specifying proportion of the dataset that should be randomly sampled for plotting
-
subset¶ Random sample of the input dataframe
-
transform_coordinates()¶ Transform coordinate system so that each point is defined relative to math model by (alpha,theta,r) (only applied to
brain.df_align)Returns: appends columns r, xc, yc, zc, ac, theta to brain.df_align
-
-
deltascope.calc_variance(anum, dfs)¶ Calculate the variance between samples according to bin position and variance between adjacent bins
Parameters: - anum (int) – Number of bins which the arclength axis should be divided into
- dfs (dict) – Dictionary of dfs which are going to be processed
Returns: Two arrays: svar (anum,tnum) and bvar (anum*tnum,snum)
Return type: np.array
-
deltascope.calculate_area_error(pdf, Lkde, x)¶ Calculate area between PDF and each kde in Lkde
Parameters: - pdf (array) – Array of probability distribution function that is the same shape as kdes in Lkde
- Lkde (list) – List of arrays of Kdes
- x (array) – Array of datapoints used to generate pdf and kdes
Returns: List of error values for each kde in Lkde
-
deltascope.calculate_models(Ldf)¶ Calculate model for each dataframe in list and add to new dataframe
Parameters: Ldf (list) – List of dataframes containing aligned data Returns: pd.Dataframe with a,b,c values for parabolic model
-
deltascope.convert_to_arr(xarr, tarr, DT, mdf, Ldf=[])¶ Convert a pandas dataframe containing landmarks as columns and samples as rows into a 3D numpy array
The columns of mdf determine which landmarks will be saved into the array. Any additional dataframes that need to be converted can be included in Ldf
Parameters: - xarr (np.array) – Array containing all unique x values of landmarks in the dataset
- tarr (np.array) – Array containing all unique t values of landmarks in the dataset
- DT (str) – Either
rorptsindicating which data type should be saved to the array - mdf (pd.DataFrame) – Main landmark dataframe containing landmarks as columns and samples as rows
- Ldf (list) – List of additional pd.DataFrames that should also be converted to arrays
Returns: Array of the main dataframe and list of arrays converted from Ldf
-
class
deltascope.embryo(name, number, outdir)¶ Class to managed multiple brain objects in a multichannel sample
Parameters: - name (str) – Name of this sample set
- number (str) – Sample number corresponding to this embryo
- outdir (str) – Path to directory for output files
-
outdir¶ Path to directory for output files
-
name¶ Name of this sample set
-
number¶ Sample number corresponding to this embryo
-
add_channel(filepath, key)¶ Add channel to
embryo.chnlsdictionaryParameters: - filepath (str) – Complete filepath to image
- key (str) – Name of the channel
-
add_psi_data(filepath, key)¶ Read psi data into a channel dataframe
Parameters: - filepath (str) – Complete filepath to data
- key (str) – Descriptive key for channel dataframe in dictionary
-
process_channels(mthresh, gthresh, radius, scale, microns, deg, primary_key, comp_order, fit_dim)¶ Process all channels through the production of the
brain.df_aligndataframeParameters: - mthresh (float) – Value between 0 and 1 to use as a cutoff for minimum pixel value for median data
- gthresh (float) – Value between 0 and 1 to use as a cutoff for minimum pixel value for general data
- radius (int) – Size of the neighborhood area to examine with median filter
- scale (array) – Array with three values representing the constant by which to multiply x,y,z respectively
- microns (array) – Array with three values representing the x,y,z micron dimensions of the voxel
- deg (int) – Degree of the function that should be fit to the model
- primary_key (str) – Key for the primary structural channel which PCA and the model should be fit too
- comp_order (array) – Array specifies the assignment of components to x,y,z. Form [x component index, y component index, z component index], e.g. [0,2,1]
- fit_dim (array) – Array of length two containing two strings describing the first and second axis for fitting the model, e.g. [‘x’,’z’]
-
save_projections(subset)¶ Save projections of both channels into png files in
embryo.outdirfollowing the naming scheme [embryo.name]_[embryo.number]_[channel name]_MIP.pngParameters: subset (float) – Value between 0 and 1 to specify the fraction of the data to randomly sample for plotting
-
save_psi()¶ Save all channels into psi files following the naming scheme [
embryo.name]_[embryo.number]_[channel name].psi
-
deltascope.find_anchors(df, dim)¶ Parameters: dim (str) – either y or z
-
deltascope.generate_kde(data, var, x, absv=False)¶ Generate list of KDEs from either dictionary or list of data
Parameters: - data – pd.DataFrames to convert
- var (str) – Name of column to select from df
- x (array) – Array of datapoints to evaluate KDE on
- absv (bool) – (or None) Set to True to use absolute value of selected data for KDE calculation
Type: dict or list
Returns: List of KDE arrays
-
class
deltascope.landmarks(percbins=[10, 50, 90], rnull=15)¶ Class to handle calculation of landmarks to describe structural data
Parameters: - percbins (list) – (or None) Must be a list of integers between 0 and 100
- rnull (int) – (or None) When the r value cannot be calculated it will be set to this value
-
brain.lm_wt_rf¶ pd.DataFrame, which wildtype landmarks will be added to
-
brain.lm_mt_rf¶ pd.DataFrame, which mutant landmarks will be added to
-
brain.rnull¶ Integer specifying the value which null landmark calculations will be set to
-
brain.percbins¶ Integer specifying the percentiles which will be used to calculate landmarks
-
calc_bins(Ldf, ac_num, tstep)¶ Calculates alpha and theta bins based on ac_num and tstep
Creates
landmarks.acbinsandlandmarks.tbinsWarning
tstep does not handle scenarios where 2pi is not evenly divisible by tstep
Parameters: - Ldf (dict) – Dict dataframes that are being used for the analysis
- ac_num (int) – Integer indicating the number of divisions that should be made along alpha
- tstep (float) – The size of each bin used for alpha
-
acbins¶ List containing the boundaries of each bin along alpha based on ac_num
-
tbins¶ List containing the boundaries of each bin along theta based on tstep
-
calc_mt_landmarks(df, snum, wt)¶ Warning
Deprecated function, but attempted to calculate mutant landmarks based on the number of points found in the wildtype standard
-
calc_perc(df, snum, dtype, out)¶ Calculate landmarks for a dataframe based on the bins and percentiles that have been previously defined
Parameters: - df (pd.DataFrame) – Dataframe containing columns x,y,z,alpha,r,theta
- snum (str) – String containing a sample identifier that can be converted to an integer
- dtype (str) – String describing the sample group to which the sample belongs, e.g. control or experimental
Returns: pd.DataFrame with new landmarks appended
-
calc_wt_reformat(df, snum)¶ Warning
Deprecated function, but includes code pertaining to calculating point based data
-
class
deltascope.math_model(model)¶ Object to contain attributes associated with the math model of a sample
Parameters: model (array) – Array of coefficients calculated by np.polyfit -
cf¶ Array of coefficients for the math model
-
p¶ Poly1d function for the math model to allow calculation and plotting of the model
-
-
class
deltascope.paramsClass(path=None, dparams=None)¶ A class to read and validate parameters for multiprocessing transformation. Validated parameters can be read as attributes of the object
-
add_outdir(path)¶ Add out directory as an attribute of the class
Parameters: path (str) – Complete path to the output directory
-
check_config(D, path)¶ Check that each parameter in the config file is correct and raise an error if it isn’t
Parameters: - D (dict) – Dictionary containing parameters from the config file
- path (str) – Complete filepath to the config file
-
-
deltascope.process_sample(num, root, outdir, name, chs, prefixes, threshold, scale, deg, primary_key, comp_order, fit_dim, flip_dim)¶ Process single sample through
brainclass and saves df to csvWarning
Out of date and will probably fail
Parameters: - num (str) – Sample number
- root (str) – Complete path to the root directory for this sample set
- name (str) – Name describing this sample set
- outdir (str) – Complete path to output directory
- chs (array) – Array containing strings specifying the directories for each channel
- prefixes (array) – Array containing strings specifying the file prefix for each channel
- threshold (float) – Value between 0 and 1 to use as a cutoff for minimum pixel value
- scale (array) – Array with three values representing the constant by which to multiply x,y,z respectively
- deg (int) – Degree of the function that should be fit to the model
- primary_key (str) – Key for the primary structural channel which PCA and the model should be fit too
-
deltascope.read_psi(filepath)¶ Reads psi file at the given filepath and returns data in a pandas DataFrame
Parameters: filepath (str) – Complete filepath to file Returns: pd.Dataframe containing data
-
deltascope.read_psi_to_dict(directory, dtype)¶ Read psis from directory into dictionary of dfs with filtering based on dtype
Parameters: - directory (str) – Directory to get psis from
- dtype (str) – Usually ‘AT’ or ‘ZRF1’
Returns: Dictionary of pd.DataFrame
-
deltascope.reformat_to_cart(df)¶ Take a dataframe in which columns contain the bin parameters and convert to a cartesian coordinate system
Parameters: df (pd.DataFrame) – Dataframe containing columns with string names that contain the bin parameter Returns: pd.DataFrame with each landmark as a row and columns: x,y,z,r,r_std,t,pts
-
deltascope.rescale_variable(Ddfs, var, newvar)¶ Rescale variable from -1 to 1 and save in newvar column on original dataframe
Parameters: - Ddfs (dict) – Dictionary of pd.DataFrames
- var (str) – Name of column to select from dfs
- newvar (str) – Name to use for new data in appended column
Returns: Dictionary of dataframes containing column of rescaled data
-
deltascope.subplot_lmk(ax, p, avg, sem, parr, xarr, tarr, dtype, Pn={'alpha': 0.3, 'cmap': 'Greys_r', 'mtc': 'r', 'tarr': None, 'wtc': 'b', 'xarr': None, 'zfb': 1, 'zln': 2, 'zpt': 3})¶ Plot a ribbon of average and standard error of the mean onto the subplot, ax
Parameters: - ax (plt.Subplot) – Matplotlib subplot onto which the data should be plotted
- p (list) – List of two theta values that should be plotted
- avg (np.array) – Array of shape (xvalues,tvalues) containing the average values of the data
- sem (np.array) – Array of shape (xvalues,tvalues) containing the standard error of the mean values of the data
- parr (np.array) – Array of shape (xvalues,tvalues) containing the p values for the data
- dtype (str) – String describing sample type
- Pn – Dictionary containing the following values: ‘zln’:2,’zpt’:3,’zfb’:1,’wtc’:’b’,’mtc’:’r’,’alpha’:0.3,’cmap’:’Greys_r’
Type: dict or None
-
deltascope.write_data(filepath, df)¶ Writes data in PSI format to file after writing header using
write_header(). Closes file at the conclusion of writing data.Parameters: - filepath (str) – Complete filepath to output file
- df (pd.DataFrame) – dataframe containing columns x,y,z,ac,r,theta
-
deltascope.write_header(f)¶ Writes header for PSI file with columns Id,x,y,z,ac,r,theta
Parameters: f (file) – file object created by ‘open(filename,’w’)`